Optimizing and Maintaining SQL Server Instance Hosting Veeam Service Provider Console Configuration Database
Purpose
This article was produced in coordination with the Veeam R&D team to provide Service Providers with a comprehensive list of the most common performance improvements and maintenance actions relating to the underlying Microsoft SQL Server instance that hosts the Veeam Service Provider Console configuration database.
The information, advice, and scripts provided in this article are provided as a courtesy. Assistance with implementing the configuration advice provided in this document is outside the scope of Veeam Support.
If you have feedback regarding the content of this article, please use the Article Feedback form.
Solution
System Requirements and Sizing Guidelines
SQL Server Instance Memory Configuration Options
Memory utilization for the SQL Server Database Engine is bounded by a pair of configuration settings, min server memory (MB) and max server memory (MB). Over time and under normal circumstances, SQL Server will attempt to claim memory up to the limit set by max server memory (MB).
Use max server memory (MB) to guarantee the OS and other applications don't experience detrimental memory pressure from SQL Server. Before you set the max server memory (MB) configuration, monitor the overall memory consumption of the server hosting the SQL Server instance during regular operation to determine memory availability and requirements.
Use SQL Server Management Studio to set server memory options:
- In Object Explorer, right-click a server and select Properties.
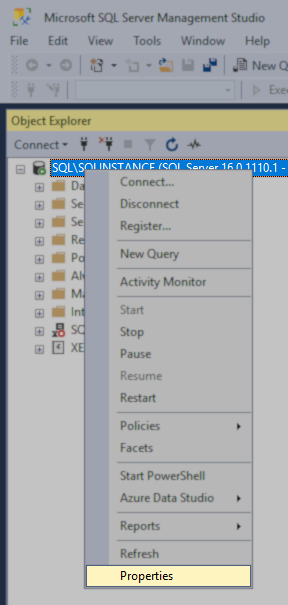
- Select the Memory page of the Server Properties window. The current values of Minimum server memory and Maximum server memory are displayed.
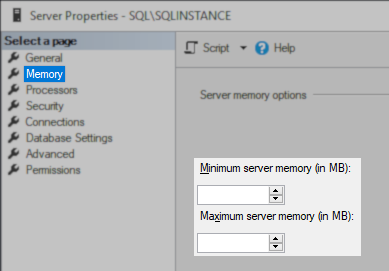
- In Server memory options, enter desired numbers for Minimum server memory and Maximum server memory. For recommendations, see min server memory (MB) and max server memory (MB).
Managing SQL Server Data and Log Files
To manage data and log files, ensure the following:
- Data and log files are on separate drives from each other and from all other files. The drive containing the data should contain only data (no logs), and the drive containing the log files should contain only log files (no data).
- Using SSD for better I/O performance.
- Auto-growth is correctly configured (10% by default).
- Instant file initialization is configured.
- Auto-shrink is not enabled and shrink is not part of any maintenance plans.
If auto-shrink is enabled, disable it by using the following command:
ALTER DATABASE VSPC SET AUTO_SHRINK OFF;Monitoring Physical Disks Performance
Performance Monitor is a built-in Windows Tool for monitoring all aspects of Windows and hosted applications such as SQL Server. A Data Collector Set is used to organize and schedule performance counter data as a single collection to be analyzed later.
To create a Data Collector Set for your physical disks:
- Launch the Performance Monitor (perfmon).

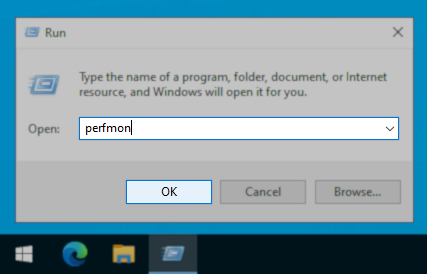
- In the Performance Monitor navigation pane, expand Data Collector Sets.
- Right-click User Defined, point to New, and click Data Collector Set.
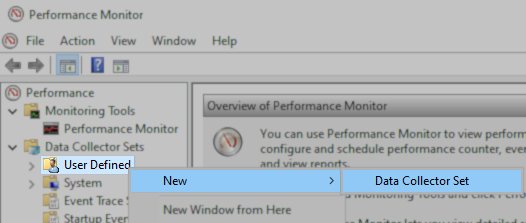
- Enter a name for the Data Collector Set and select Create manually, then click Next.
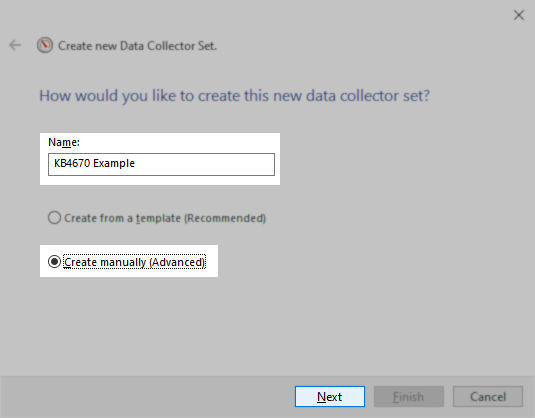
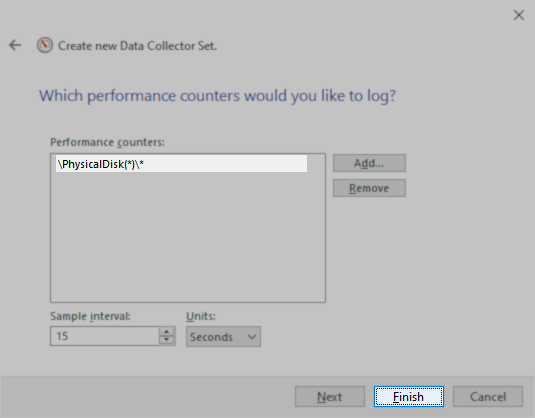
- Select Create data logs, check the Performance counter box, and click Next.
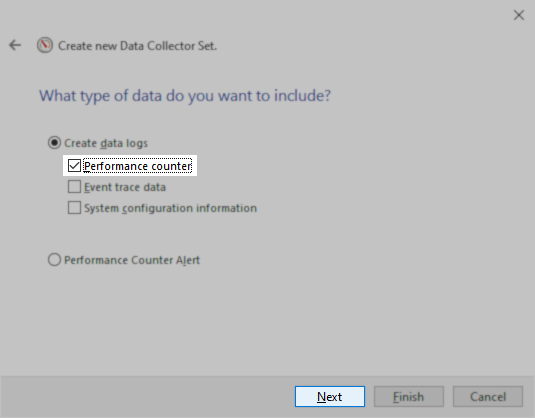
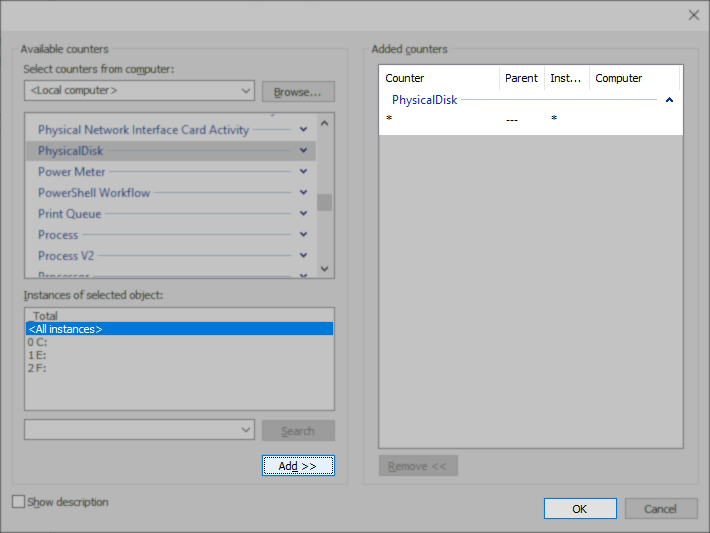
- Click Add to open the Add Counters dialog box.
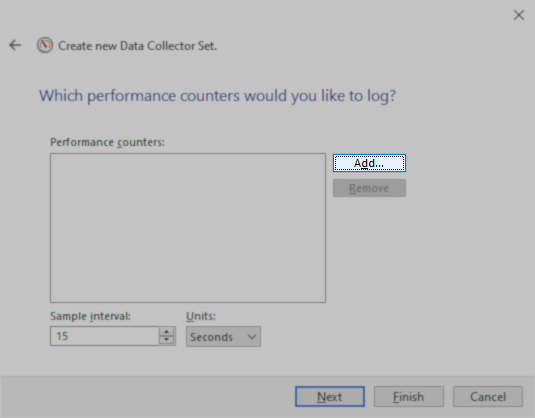
- Find and click the category entry PhysicalDisk, the Instances of selected object section will update.
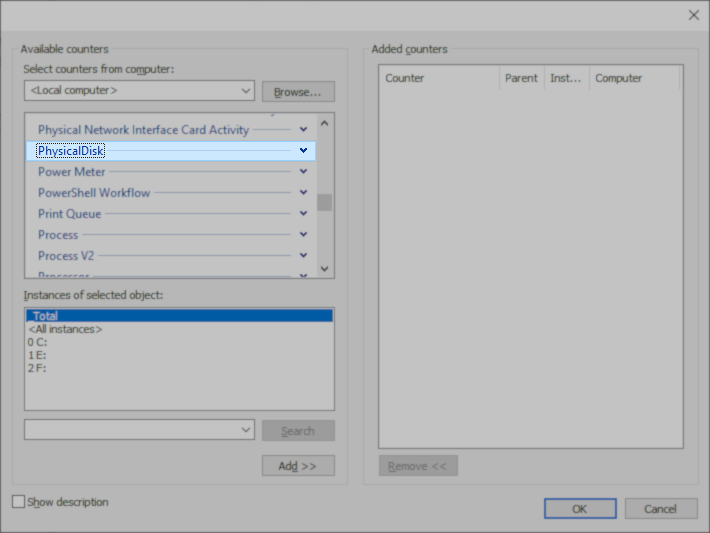
- Double click <All instance> to add the PhsysicalDisk counters to the Added counters list, then click OK.
- Click Finish to exit and save the current configuration.
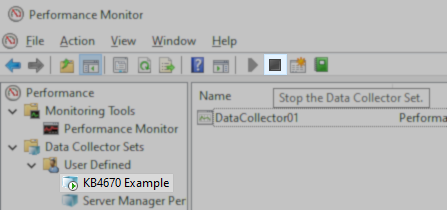
- Start the created data collector set by right-clicking on it and selecting Start.

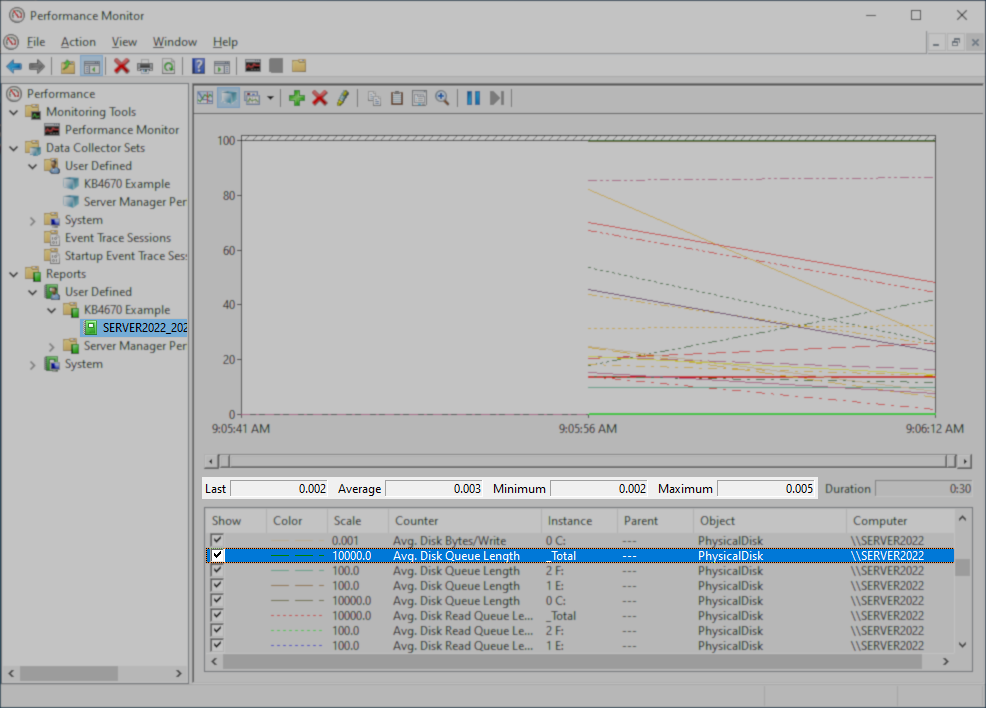
- After a while, stop the data collection by clicking the Stop the Data Collector Set button.
Reviewing SQL Server Logs
There are several areas where SQL Server logs information about processes that are occurring as well as errors that occur. The most used is probably the SQL Server Error Log. This error log provides startup information, integrity check information, backup information, and other information, as well as any SQL Server errors that occur.
To get to the MS SQL Server Logs, follow these steps:
- In Object Explorer, expand the Management node and the SQL Server Logs node.
- Right-click on the Current log entry and select View SQL Server Log.
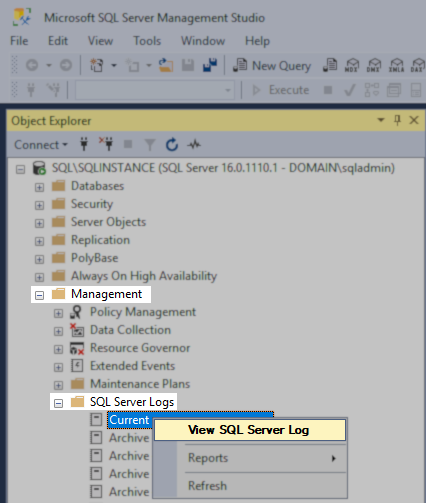
- In the Log File Viewer, you can analyze and export logs.
Monitoring VSPC Database Staging Tables
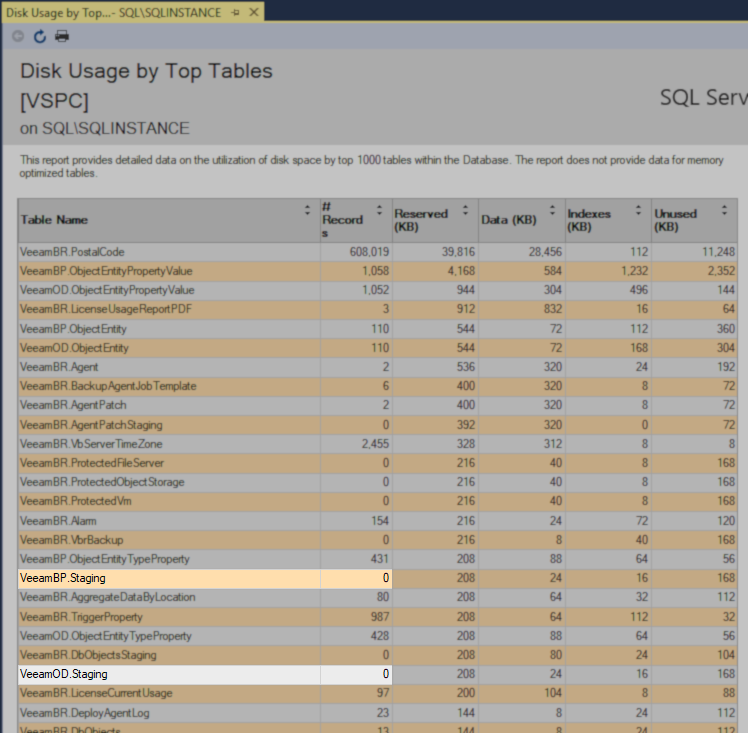
Almost all of the data collected by VSPC goes through Staging tables. It is important that these tables maintain as near to zero records as possible. If the number of records continues to increase, it could indicate that there is a performance issue.
To check how many records Staging tables have:
- In Object Explorer, right-click the VSPC database and go to the Reports -> Standard Reports, select the Disk Usage by Top Tables report.
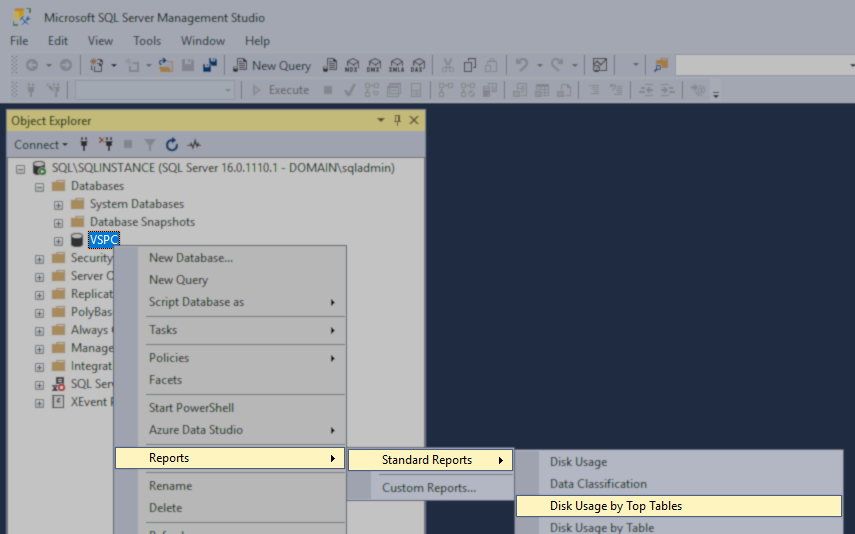
- Check how many records VeeamBP.Staging and VeeamOD.Staging tables have.
Database Shrinking Considerations
To view the current amount of free (unallocated) space in the database, see Display Data and Log Space Information for a Database.
Shrink Considerations and Limitations
Consider the following information when you plan to shrink a database:
- A shrink operation is most effective after an operation that creates a large amount of unused storage space, such as a large DELETE statement, truncate table, or a drop table operation.
- Most databases require some free space to be available for regular day-to-day operations. If you shrink a database repeatedly and notice that the database size grows again, this indicates that the free space is required for regular operations. In these cases, repeatedly shrinking the database is a wasted operation. Repeatedly shrinking the database causes the SQL instance to trigger autogrow events to grow the database file(s), which hinders performance.
- A shrink operation doesn't preserve the fragmentation state of indexes in the database and generally increases fragmentation to a degree. This is another reason not to shrink the database repeatedly.
- Unless you have a specific requirement, do not set the AUTO_SHRINK database option to ON.
Shrink operations in progress can block other queries on the database and can be blocked by queries already in progress.
Database Shrinking Documentation
Fragmentation Impact of Shrinking Database
Data that is moved to shrink a file can be scattered to any available location in the file. This causes index fragmentation and can slow the performance of queries that search a range of the index. To eliminate the fragmentation, consider rebuilding the indexes on the file after shrinking.
Rebuilding Table Indexes
Index and data pages can experience internal fragmentation. Index and table structures can experience logical scan and extent scan fragmentation. Periodically check index fragmentation of the VSPC database. The most sensitive tables for index fragmentation are:
- VeeamBP. ObjectEntityPropertyValue
- VeeamOD. ObjectEntityPropertyValue
- VeeamBP.ObjectEntity
- VeeamOD.ObjectEntity
Check Index Fragmentation using SQL Server Management Studio:
- Right-click the VSPC database and choose Reports -> Standard Reports.
- Select the Index Physical Statistics report.
You’ll see table names, indexes, and operation recommendations in that report. Follow the recommendations and rebuild\reorganize indexes.
Rebuild vs Reorganize Indexes
Please note that rebuilding indexes is a heavy task that can take a lot of time. Additionally, online indexing can only be done with the Enterprise Edition of Microsoft SQL Server. In other editions of the SQL Server, only offline indexing is available, meaning tables having their indexes rebuilt will be locked during the rebuild operation. Reorganizing the index, on the other hand, is less heavy an operation and can be done online with all editions. Generally speaking, reorganizing indexes is preferable to rebuilding when possible.
How to Rebuild Indexes (Offline)
- In Object Explorer, select the plus sign next to the VSPC database.
- Expand the Tables folder.
- Select the plus sign to expand the table whose indexes you want to rebuild.
- Expand the Indexes folder.
- Right-click the index that you want to rebuild and select Rebuild.
- In the Rebuild Indexes dialog box, verify that the correct index is in the Indexes to be rebuilt list and click OK.
How to Rebuild Indexes (Online)
For information about rebuilding Indexes (Online) with SQL Server Enterprise Edition, please review Microsoft documentation:
SQL Server - Perform index operations online - Use SQL Server Management Studio
How to Reorganize Indexes
- In Object Explorer, select the plus sign next to the VSPC database.
- Expand the Tables folder.
- Select the plus sign to expand the table whose indexes you want to reorganize.
- Expand the Indexes folder.
- Right-click the index that you want to reorganize and select Reorganize.
- In the Reorganize Indexes dialog box, verify that the correct index is in the Indexes to be reorganized list and click OK.
Updating Table and Index Statistics
Check if Auto Update Statistics is ON
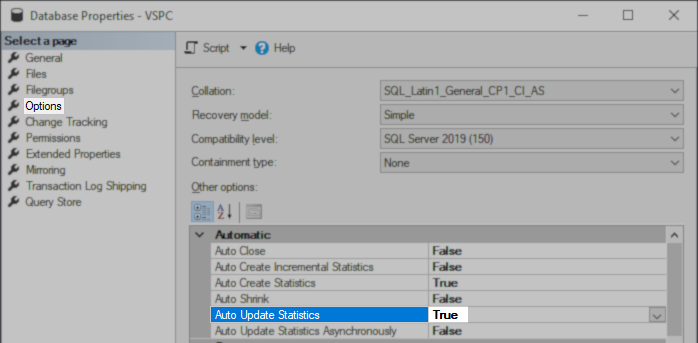
- Right-click the VSPC database and choose Properties.
- In the navigation menu on the left, select Options.
- Check if Auto Update Statistics has the True value and set it to the True if it’s not.
- Click OK to close the Database Properties.
Check VSPC Database Statistics Relevancy
You can check how irrelative the statistics are in your VSPC DB using the following query:
set transaction isolation level read uncommitted;

select quotename( sh.[name] ) + N'.' + quotename( t.[name] ) as [object_name]
     , s.stats_id
     , quotename( s.[name] ) as stat_name
     , s.auto_created
     , s.user_created
     , s.no_recompute
     , replace( sc.stat_columns, N'] [', N'], [' ) as stat_columns
     , cast( sp.last_updated as datetime2( 3 ) ) as last_updated
     , sp.[rows]
     , sp.rows_sampled
     , sp.steps
     , sp.modification_counter
     , ltrim( format( cast( sp.modification_counter as decimal( 20, 2 ) ) / cast( sp.[rows] as decimal( 20, 2 ) ), N'# ##0.00 %' ) ) as irrelevance
     , s.filter_definition
  from sys.schemas sh
    inner join
      sys.tables t on t.[schema_id] = sh.[schema_id]
    inner join
      sys.stats s on s.[object_id] = t.[object_id]
    outer apply
      ( select quotename( c.[name] ) as [data()]
          from sys.stats_columns sc
            inner join
              sys.columns c on c.[object_id] = sc.[object_id] and c.column_id = sc.column_id
          where sc.[object_id] = s.[object_id]
            and sc.stats_id = s.stats_id
          order by sc.stats_column_id
          for xml path( '' ) ) sc( stat_columns )
    outer apply
      sys.dm_db_stats_properties( s.[object_id], s.stats_id ) as sp
  order by [object_name], s.stats_id;
goHow to Update a Statistics Object (using SQL Server Management Studio)
- In Object Explorer, select the plus sign next to the VSPC database.
- Expand the Tables folder.
- Select the plus sign to expand the table whose statistic you want to update.
- Expand the Statistics folder.
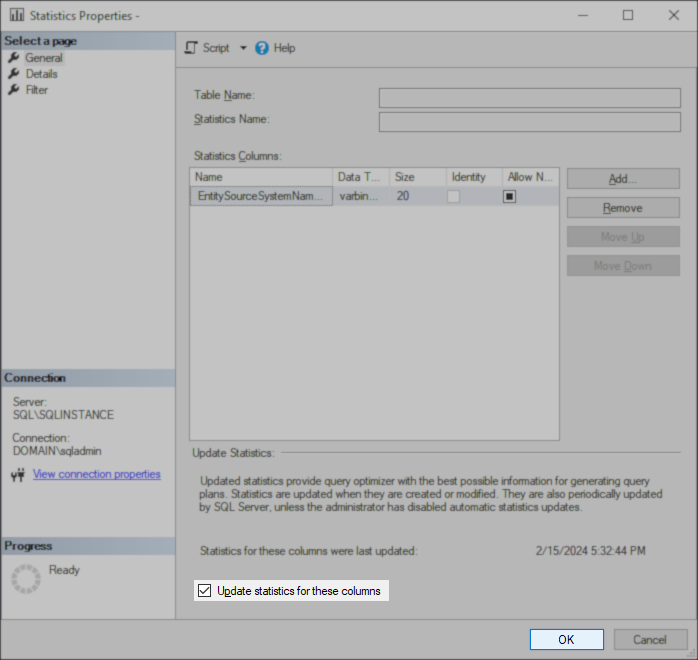
- Right-click the statistics object you wish to update and select Properties.
- In the Statistics Properties dialog box, select the check box labeled "Update statistics for these columns" and click OK.
How to Update a Single Statistics Object using Transact-SQL
- Connect to the SQL Server instance.
- Click New Query.
- Copy and paste the following example into the query window and click Execute.
Note: The statistic in this example can be changed to any statistic you'd like to update.
-- Use the name of your VSPC database instead of the VSPC_DB_NAME
USE VSPC_DB_NAME;
GO
-- The following example updates the statistics for the INDX_ObjectEntityPropertyValue_IsDeleted_DateTime index of the VeeamBP.ObjectEntityPropertyValue table.
UPDATE STATISTICS VeeamBP.ObjectEntityPropertyValue
INDX_ObjectEntityPropertyValue_IsDeleted_DateTime;
GOHow to Update all Statistics for a Specific Table using Transact-SQL
- Connect to the SQL Server instance.
- Click New Query.
- Copy and paste the following example into the query window and click Execute.
Note: The table in this example can be changed to any table whose statistics you'd like to update.
-- Use the name of your VSPC database instead of the VSPC_DB_NAME
USE VSPC_DB_NAME;
GO
-- The following example updates the statistics for all indexes on the VeeamBP.ObjectEntityPropertyValue table.
UPDATE STATISTICS VeeamBP.ObjectEntityPropertyValue;
GO How to Update all Statistics in a Specific Database using Transact-SQL
- Connect to the SQL Server instance.
- Click New Query.
- Copy and paste the following example into the query window and click Execute.
Note: The statistic in this example can be changed to any statistic you'd like to update.
-- Use the name of your VSPC database instead of the VSPC_DB_NAME
USE VSPC_DB_NAME;
GO
-- The following example updates the statistics for all tables in the database.
EXEC sp_updatestats;
To report a typo on this page, highlight the typo with your mouse and press CTRL + Enter.